|
Welcome to "today in headlines I thought I'd never write."
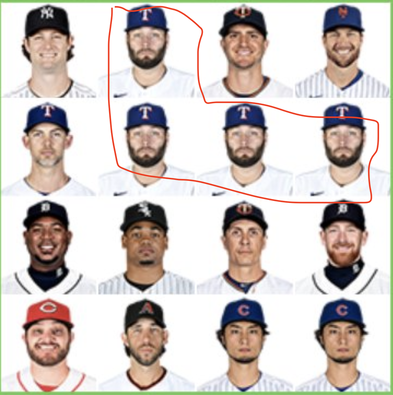
Jokes aside, earlier this week, Darren Willman, the Director of Baseball Research and Development for MLB, tweeted out a pretty cool chart:
As you can see, in each portion of the strike zone, a pitcher's face represents who threw the most fastballs in that zone. And if you zoom in on the very center of the strike zone, you see a bearded man in a Texas Rangers cap appear rather frequently:
That, my friends, is Lance Lynn. Not just any Lance Lynn, but a Lance Lynn who somehow was the third most-valuable pitcher in baseball last year. A Lance Lynn who put up a 66 FIP- in 208.1 innings, striking out 28% of batters faced and walking just 7%. And he seemingly did this by just putting his mid-90s fastball in the middle of the strike zone.
Of course, there's more to it than that, but today I want to focus in on Lynn's in-zone fastballs. That's it. While I normally like to profile players in their entirety, that's not the plan here. I am just going to evaluate Lynn's middle-middle fastballs, and hypothesize how that could have been one of the reasons why he had a career year last year. Because there must be some relation between those variables. First, a quick overview of Lynn's four-seam fastball:
So the important takeaway is this: any individual Lance Lynn pitch from the entire 2019 season had roughly a 33% chance of being a fastball in the strike zone. In theory, you would think that this would spell trouble for Lynn, considering in-zone fastballs are generally hit pretty hard: Hitters posted a .352 wOBA on in-zone fastballs last year, irrespective of count or precise location. Put simply, if any four-seam fastball was in the strike zone, all hitters were producing at roughly the career output of Yoenis Cespedes (.351 career wOBA). Lynn, however, allowed just a .293 wOBA on in-zone fastballs last year, ranking 10th out of the 74 pitchers with at least 500 results. This, though, only scratches the surface of Lynn's dominance. Since wOBA only considers results, this wouldn't take into account favorable outcomes that occur within an at bat: whiffs and called strikes. Thus, we dive a bit deeper into what exactly happens when Lynn throws a fastball in the strike zone. Let's start with 1,140, the total number of Lance Lynn in-zone fastballs:
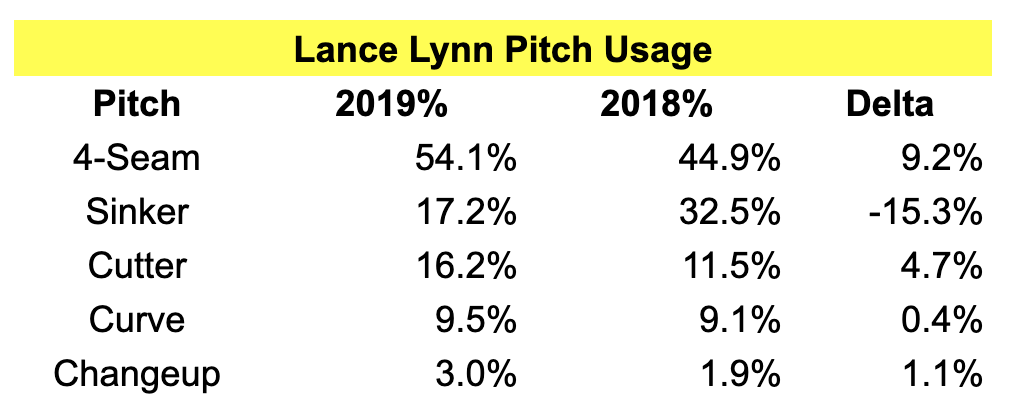
Now, we can distill down Lynn's in-zone fastballs further. There were 1,135 of them on which a hitter made a decision, but only on 242 did they even put the ball in play, or 21.2% of the time. Perhaps surprisingly, this wasn't jumping off the leaderboards. He ranked at about the 73rd percentile league-wide. But we have to get back to the original point of the story: Lynn does this more often than just about anyone else. You might have noticed that I was setting the total pitch thresholds to relatively low value: either 300 in-zone swings or 500 total results, just to get a decent-sized sample in order to compare Lynn's skill level. The problem with that is that Lynn succeeded in part because of how often he poured the fastball into the zone. While the aforementioned rates compare favorably to the rest of the league overall, he was being pitted against pitchers who potentially experienced results half as often as he did. Only six pitchers even threw their fastball in the zone more than 900 times: Matt Boyd, Gerrit Cole, Reynaldo Lopez, Lynn, Jake Odorizzi and Justin Verlander. That's a pretty sterling group of names overall, but even among them Lynn stands out: To repeat, he threw his fastball in the strike zone 1,140 times last year, 26% more than the extraordinarily high threshold marker I just set. That's why these rates, while important, don't tell the full story, and if they do, the concept of diminishing returns could be at play. Is Lynn above the optimal number of in-zone four-seamers? Would his rates play up even more had he thrown fewer in-zone fastballs? Is the trade-off worth it? Let's say Lynn doesn't have anything better to throw in place of these in-zone four-seamers. Would he take a slightly reduced effectiveness on his four-seam fastball over throwing a potentially worse pitch overall in that spot? The answer, at least for him, was yes. Lynn had some pretty successful secondary stuff last year as well (those curveball numbers were fantastic) but because pitching is so interdependent, it's possible that those results were favorable because he threw non-fastballs less often. These are tougher questions to answer with data alone, but they are important factors to consider. I do think that this trade-off is at least part of the explanation. Let's look at Lynn's overall pitch usage in both 2018 and 2019:
Lynn effectively cut his sinker usage in half, in exchange for more of his fastball and, to a lesser extent, for more of his cutter. Incredibly, all three pitches somehow got better. It's hard to speculate why, but even going off of 2018 numbers, it made total sense to ditch a pitch with a .349 xwOBA and 17.5% whiff rate (his sinker) for more of one with a .324 xwOBA and a 26.3% whiff rate (his fastball). How both of these pitches got better individually is more difficult to explain.
Lynn did pretty drastically alter his arm slot this year, allowing his fastball to increase its velocity and spin rate. The velocity might be able to explain part of the improved results. Spin, however, might not because even with his 90th percentile total spin rate, Lynn was one of the worst at turning it into "active spin." "Active spin" is what directly contributes to movement. Ultimately, his fastball was not of the rising variety, à la Cole or Verlander. Rather, it actually dropped more than the average fastball at his velocity. Regardless of the pitch characteristics themselves, Lynn had a career year, and he did so in part by pouring the fastball into the strike zone. It was clearly an effective approach, and undoubtedly made for a fun graphic. More of the bearded man in the Texas Rangers hat in the middle, please.
0 Comments
Your comment will be posted after it is approved.
Leave a Reply. |


 RSS Feed