|
Given the current state of negotiations between Major League Baseball and the Major League Baseball Players Association, it still remains to be seen whether we’ll have baseball in 2020. With Friday’s news of eight positive COVID-19 tests at the Phillies’ spring training complex, we’re reminded that 2020 baseball may hinge less on the “when and where” than it does on the “how.”
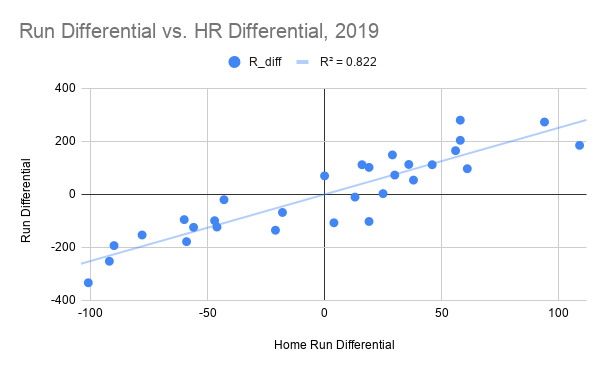
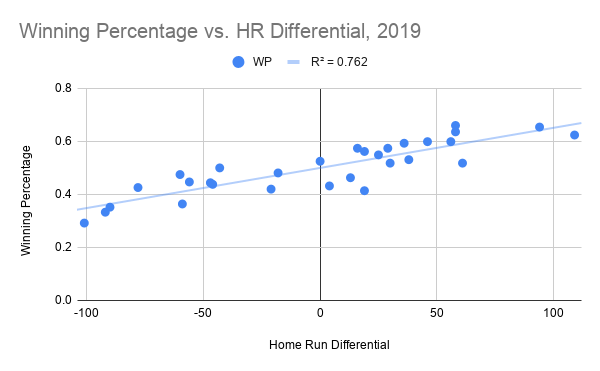
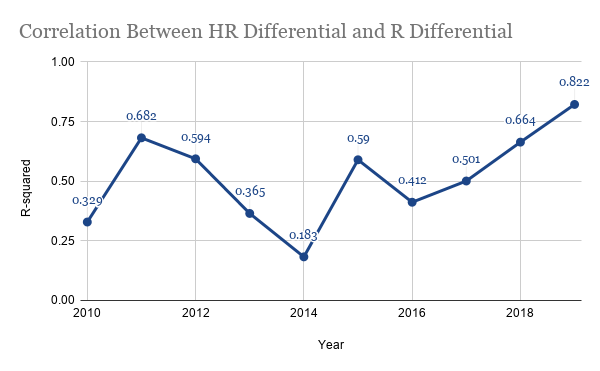
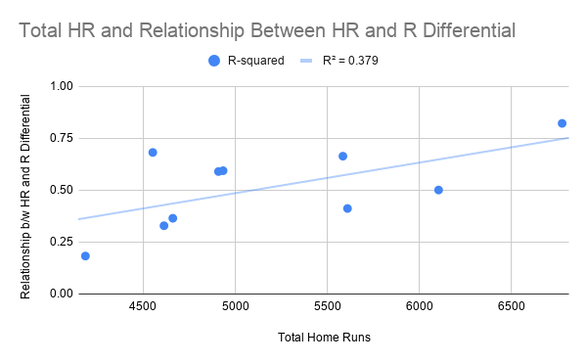
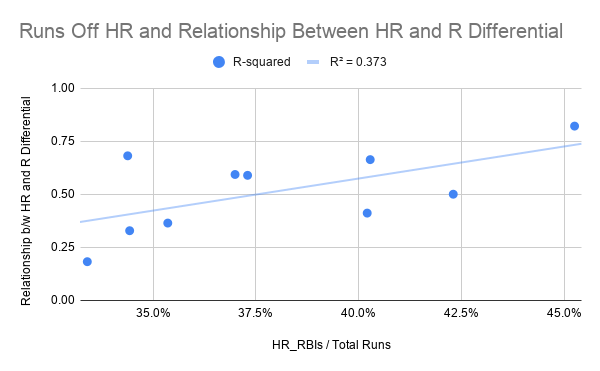
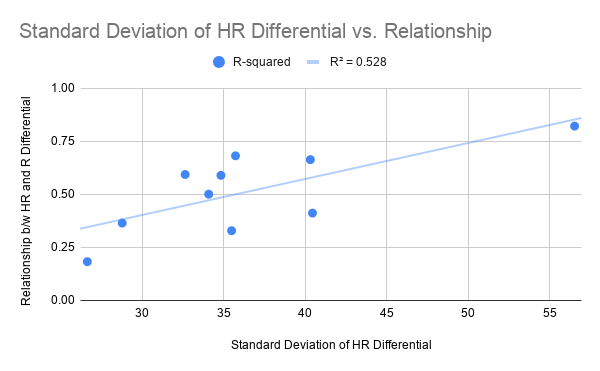
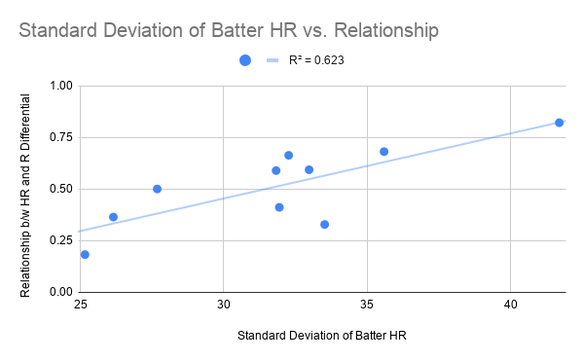
With the constant stalemates and the associated swings in optimism for a baseball season, I’ve thought about what I could possibly write. It can be difficult to develop article ideas for a sport that remains sidelined, but longer-term research questions that I have had remain unsolved. So, baseball or not, I’m going to continue to attempt to answer them. That’s what brings me back to 2019. Last year, an incredible 6,776 home runs were hit league wide. That figure broke the old record — set just two years prior — by 671. It’s more than 1,000 additional home runs than the season that sits in third place — 2000, which witnessed 5,693. It’s almost certainly the baseball that has driven this upswing (pun fully intended), though an increased focus on hitting more fly balls has likely contributed as well. This got me thinking though: Were home runs less important last season? Thirty home runs used to be a milestone; in 2019, nearly 40 percent of qualified hitters eclipsed that mark, those as good as Mike Trout (180 wRC+) to as bad as Rougned Odor (77 wRC+). Thirty home runs seemingly meant very little. But, for every home run hit, there was a home run surrendered. Trout went yard 45 times last season. Three of those came off of Ariel Jurado. Lance Lynn, Mike Fiers, Mike Leake and Aaron Sanchez allowed two each. That means that nearly one-quarter of Trout's 2019 home runs can be accounted for through just five pitchers. On a macro level, this begs the question: How does home run differential factor into a team’s success? If home runs were so prevalent in 2019, then teams who both hit a lot of them and surrendered few likely did well overall, one would think. After running the results, they did better than I ever would have expected. The r-squared between a team’s home run differential (homers hit - homers allowed) and a team’s run differential was a staggering .822. This means that 82.2% of a team’s run differential can be explained by their home run differential alone. That’s pretty powerful, especially when one considers that run differential is understood to be a more effective measure of a team’s true strength than current record. Indeed, using 2019 data, I found that there was quite a strong relationship between a team’s home run differential and their winning percentage (r-squared: .762). Each additional home run was worth, on average, 1.5 points of winning percentage. We can convert that directly into wins. In a 162-game baseball season, each win is equal to 6 additional points of win percentage. Thus, in 2019, if each home run was worth 1.5 winning percentage points, then four home runs equaled one additional win. It is important to note that this is in relation to an 81-81 team. A good way to understand this is by looking at examples. The 2019 Brewers had a home run differential of +25, equivalent to roughly 6.25 wins above average, or 87.25 wins in total. They won 89 games. Meanwhile, the Rockies had a home run differential of -46, equivalent to an expected 69.5 wins. They won 71. When looking at prior years, this tool appears to be less useful. From 2010 to 2018, the correlation between a team’s home run differential and their overall run differential varied pretty widely, from as low as .183 in 2014 to as high as .682 in 2011: This variation seems somewhat random, which raises further questions about whether this will remain a viable tool in the years to come. The most obvious explanation is that more home runs creates a larger disparity between home run differentials, but the correlation between home run total and the relationship is only moderate: A second potential input variable is the percentage of runs scored off of home runs as a total of the league’s runs scored. The logic here is that during years when home runs represent a larger portion of league-wide scoring, home run differential would represent a larger portion of run differential. Again, only a moderate relationship: In both, 2011 remains a huge outlier. Only 4,552 home runs were hit (2019: 6,776). They only represented 34% of all run scoring (2019: 45%). How, then, did this explain such a large portion of run differential? The answer potentially lies in the distribution of home runs. If there is a large disparity in how home runs are “allocated” throughout the league, then you could see this more closely begin to mirror run differential. In years where most teams hit (or allow) around the same number of home runs, run differential must be determined by other factors. But, in years where some teams hit many more home runs than others, run differential becomes more closely attributed to home run differential. There are a few different ways to see this in the data. First is by looking at the standard deviation of home run differentials, which produces an r-squared of .528: A more effective way to see this trend is by analyzing just the standard deviation of home runs hit. This is likely because pitcher home runs are more difficult to control. When we evaluate the standard deviation of home runs hit and the relationship between home run and run differential, we get an r-squared of .623: This tells us that the Twins strategy works, even in less wonky years. Center your entire game around the long ball, and you’ll succeed. We constantly hear about how the 2019 Twins set the single-season home run record with 307 blasts. What is less discussed is that the Twins also ranked as the fifth-best team in home run prevention last year — they only allowed 198 homers. This strategy works, and until other teams attempt to do the same, they’ll maintain a relative competitive advantage — even if some of their luck on the pitching side runs out. Baseball was undoubtedly weird in 2019, and if we get the sport back this year, I’ll be watching to see not only who hits the most home runs, but how they are distributed amongst the 30 teams. --Devan Fink Correction, 6/22/2020, 2:05 pm EDT: This article originally stated that 70% of Trout's home runs could be accounted for through just seven pitchers. The individual pitcher home run totals were a reflection of Trout's career stats, not his 2019 stats. The article has been updated to reflect the changes. Thank you to Steve Paradzinski for the catch.
1 Comment
Jeff Krasney
6/23/2020 12:54:54 pm
Standard deviation and baseball, examining the home runs hit as well as the differentials of preventing home runs by pitchers - quite fascinating.
Reply
Your comment will be posted after it is approved.
Leave a Reply. |
 RSS Feed